MavilimW and Stop Loss IndicatorMavlimW and Stop Loss Indicator scripts which have prepared by kivancfr3762, are merged .
kivancfr3762 hocanın önemli çalışmaları, mavilimW ve Stop Loss Indicator betiklerinin birleştirilmiş halidir.
"stop loss" için komut dosyalarını ara

ATR or % Based Trailing Stop for Delta Exchange (trade_crush)This indicator calculates and visually displays a dynamic trailing stop line on the chart based on either the Average True Range (ATR) or a fixed percentage of the current close price. Designed especially for futures or crypto traders using Delta Exchange, it helps determine where to place trailing stop loss orders to manage risk effectively.

Mastering ATR for Smart Stop Loss and Take Profit PlacementUsing the ATR indicator to set Stop Loss and Take Profit levels provides a dynamic and flexible way to manage risk based on the volatility of the market. This method ensures that your SL and TP are always in tune with current market conditions, preventing unnecessary stop-outs while maximizing the potential for profit. The table in the script makes it easy to view your calculated levels directly on the chart, improving your trading efficiency.
If you're looking for a more automated way to manage your trades, integrating ATR-based SL and TP can be a powerful tool in your strategy.
Happy Trading!

ATR Trailing Stop Loss [V5]A complete ATR Trailing Stop Loss in version 5.
Features Include:
Timeframe Option
Long/Short Triggers (Green/Red Triangles)
Long/Short Conditions (Bottom Colored Line)
"Golden" Long/Short Triggers (Yellow Triangles)(Hanging Man or Shooting Star Candlestick patterns breaking ATR trailing stop)
Alerts

Auto Stop
A simple script using the last three bars(including the current) and draws a line on the chart under that for an easy automated stop loss point

ATR with Take and StopThis simple indicator will plot the take profit and stop loss values based on the ATR indicator.
It's possible to set how many times the ATR value will be applied to the closing price and
what trade type is used, Long or Short.

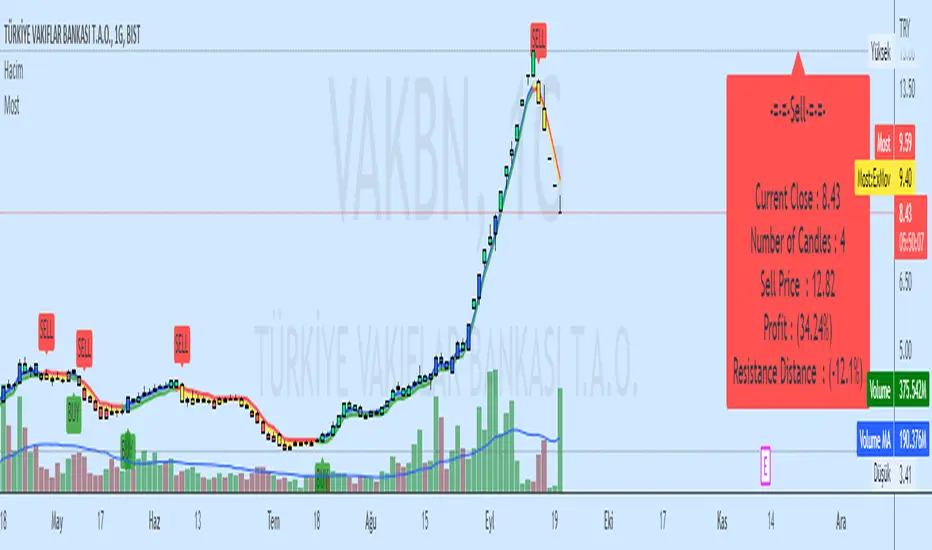
Moving Stop Loss (Most) by ceyhunATR is an indicator that has been removed and replaced with a moving average.Bar colors and infopanel have been added.
//Barcolor
Green = ExMov > Most and close > Most and low > Most
Blue = ExMov > Most and close > Most and low < Most
Red = Most > ExMov and close < Most and high < Most
Yellow = Most > ExMov and close < Most and high > Most
//It gives White color where there is deterioration.
//InfoPanel
Buy Price = Blue draws the circles at the purchase price.
Profit Long>20 = Risk level taken as a percentage, I got the highest 20%, you can determine as you wish.
Sell Price = Red draws the circles at the purchase price.
Profit Short>20 = Risk level taken as a percentage, I got the highest 20%, you can determine as you wish.
==Atr Original Code==
CDC ATR Trailing Stop V2.1 (2013)
==Most Code==
MOST by Anıl ÖZEKŞİ
Barcolor
Barcolor
ATR Pips with Stop LossThis indicator shares ATR pips and a calculated 1.5 x stop loss calculation.
1st number is ATR.
2nd number is ATR x 1.5 (a typical SL when trading daily time frame).
The plot lines are really not that important- it's the actual numbers.
What I do is uncheck the plot line checkboxes (ATR & SL) so it doesn't show up, that way I can reduce the indicator window.
This script is a modified script by ATR Pips . Kept the BB section for now as it might be useful, but doubt it.
Future updates:
- editable the multiple for SL
- static daily numbers (right now this shows the timeframe you are viewing, I'd keep that but add a static daily ATR so you have both)

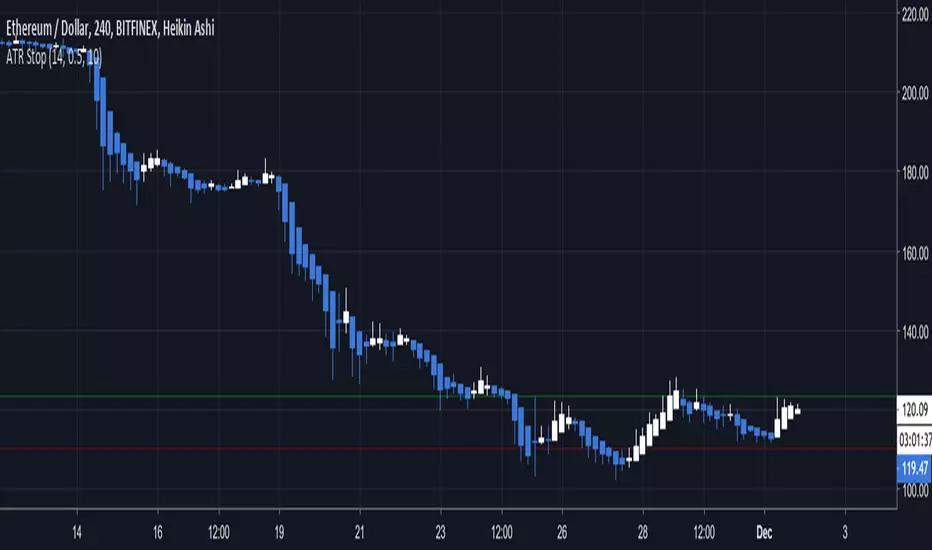
ATR Stop Loss VisualizerThis will help you figure out what stop loss settings work best for you. Some people might prefer ATR 14 * 0.5 for shorter timeframes, some might prefer more extreme settings such as ATR 30 * 2 to not get stopped out as often.
VYW Stop Loss LinesA simple utility designed to visually display Stop Loss lines on the chart based on an offset from the current price (the orange dashed lines in the screenshot above).
This indicator can also draw a line from the current bar's close price to the Price axis (the dashed gray line in the screenshot above).

Dual MA Crossover with Profit Targets + Stop-LossChatGPT script and is a dual moving average crossover script with profit targets and stop loss

SMA150 Stop Loss AlertSMA150 indicator that alerts you when stock falls under 150 with additional of -2% (for avoiding early stop-loss)

ATR stop lossPlots the stop loss level based on average true range (ATR) and a multiplier of choice (1 to 2.5, default is 1.5), subtracted from closing price.
Additions in this version:
You can now show percentage labels to help evaluate the level of risk.
The color of the plotted line and the text labels can be picked by the user.

isamuch - 2MA Cross and Stop Lossสัญญาณซื้อ/ขาย : มาจาก Moving Average สองเส้นตัดกัน
Stop Loss : มาจากราคาต่ำสุด/สูงสุดของช่วงระหว่าง Moving Average สองเส้นตัดกันก่อนหน้ากับ Moving Average ตัดกันปัจจุบัน

MultiPrice AlertThis is an alert script using Pinescript version 4. This enables one to set 5 alerts (1 StopLoss, 4 Targets), on 3 different symbols, at using a single alert in the UI.
Every visible line will only appear on the symbols that are selected. After setting targets when making an alert, select this indicator as a condition. Change the name to whatever you want, usually the names of the set of tickers.
The Alert message is dyanmic showing which Symbol with each type of alert, at whatever price.
Ability to disable the targets + symbols.
Alerts work by Stop Loss crossing under price and Targets Cross Over. Enabling the "Short" Targets reverses this.
The line that is being displayed is actually the price of the asset being moved over x number of bars. I have not found a way to plot a traditional horizontal line, as the code for it uses a fixed price.
As it being a user input, it is a variable. Any help with this would be appreicated.
Alerts are set to once per bar.
Known bug that sometimes if the prices that you set are inside the current candle stick, then your alert will immeaditally fire, either change the timeframe or let it fire and wait fo
After a target is hit, I reccomend setting the alert to 0 and REMAKING the alert. You MUST REMAKE THE ALERT AFTER ANY CHANGES. This script WILL NOT CHANGE ALERTS AS YOU CHANGE SETTINGS.
TradingView Alerts are not this smart , at least I haven't found a way to do this yet.

Anti-Volume Stop Loss multi timeframe [LM]Hello Traders,
I would like to introduce you fork of popular indicator Anti-Volume Stop Loss created by Buff Dormeier and cracked here on tradingview by @Rafka so shout out to him. I have tried to crack it myself as well as I'm big fan of Dormeier's work but it's not easy so really big thanks to Rafka
I have refactored original script and have included multi timeframe setting.
As its shown below you can select higher timeframe to track lower one:
Enjoy!

ATR Stop Loss LONG/SHORT by melihgulerYou can monitor the stop loss level according to ATR in 2 ways (Long/Short).

RSI + EMA+ MTF Stop-LossThis is a simple RSI with multiple MTF (No security) to help with direction short and long-term.
The rsi for the current chart has a noise reduction, while the rest are based on ma's.
I have supplied an extra flexible mtf rsi ma for potential adjustable/long-term stop-loss or direction identification.
Enjoy

RSI Stop LossExperiment for using RSI as a stop loss value, shows where the price will be when the RSI increases or decreases by a specified amount.


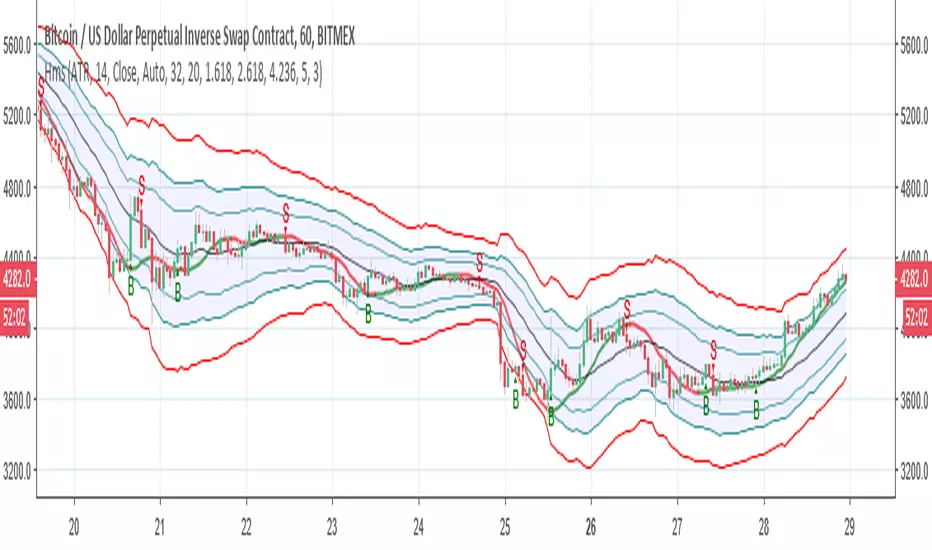
poki buy and sell Take profit and stop lossThis indicator is based on modelius model of lazy bear weis model with ATR for the buy=B sell =S
in addition there is Take profit and stop loss in % both for short and for long
next stage is to know the resistance level and support based on bollinger marked in blue and red dots
Also included Parabolic Sar (blue and red dots rising up or down)
The color of bulish or bearish zone is based on the cross of Hull avreage and linear regression ( for each time set may need different setting for accuracy )
So how to use this scrupt to better profit
1. if you have B signal and its on lower support level then its good starting place for buy. look at the Parabolic Sar if its in agreement. The exit can be either by S =sell, Take profit that you decide on % or by end of Parabolic SAR upward
2. exact the oposite for short
Play with setting for the desired results or change modify this script for your purpose

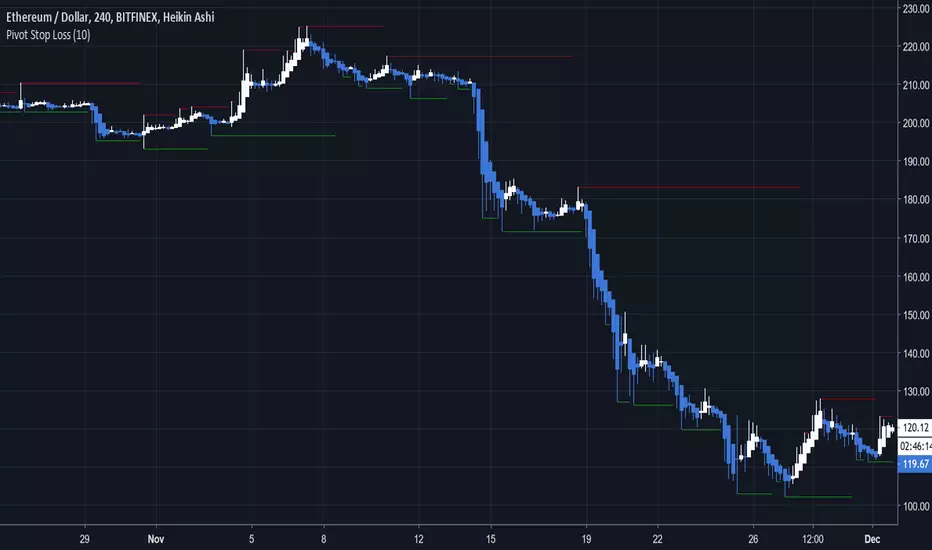
Pivot Stop LossHere we intend to use pivot points for stop loss and take profit. This has the added benefit of helping you to visualize support and resistance levels.
Hull modelius take profit and stop lossThis model has Hull moving average, fibs in form of Bollinger ,SMA and Modelius model with ATR for buy and sell power based on weis volume. Inside alerts for buy and sell. take profit and stop loss for both longs and shorts
so have fun